Click on images to enlarge
Southeast Arizona Copper & Gold
Red Rock Canyon Gold Project, adjacent and north of Hay Mountain Project
Red Rock Canyon Gold Project Images & Maps
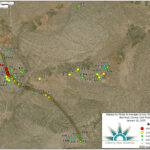
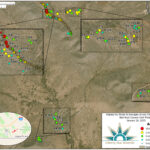
- Gold grades avgs / channel sampling project 2024
- Gold grades avgs / channel sampling project 2024
- Gold intercepts 2020 – 2021
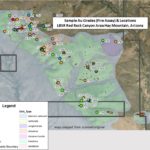
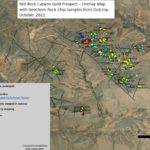
- RRC Assay Map with fire assay grades Oct 2021
- 36. RRC Assay Map with rock chip sample numbers Oct, 2021
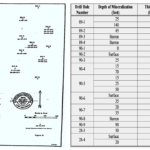
- Historical Assay Results 1990’s
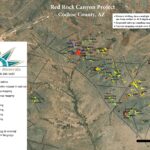
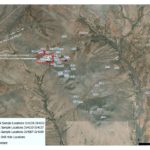
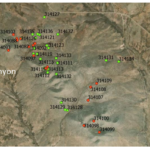
- Observed drill holes & geochem sampling 2020 – 2021, RRC
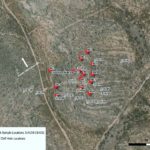
- Close up of the observed drill hole locations w/ geochem sample locations, RRC May 2021
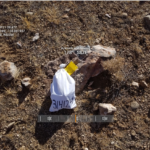
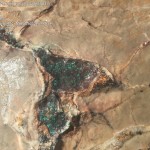
- Silica blowout exposed in alluvium, geochem sampling, RRC Jan 2021
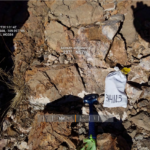
- More silicification in limestone. geochem sampling, RRC, Jan 2021
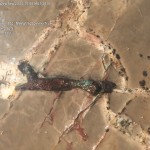
- Lens of Silicification in limestone, geochem sampling, RRC, Jan 2021
- Silica blowout exposed in alluvium, geochem sampling, RRC Jan 2021
- Close-up silicification in limestone, geochem sampling, RRC Jan 2021
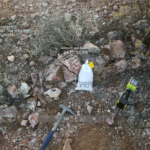
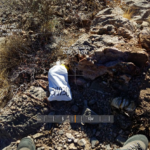
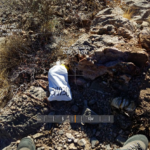
- Rock chip sample sites RRC, Oct 20 & Jan 2021
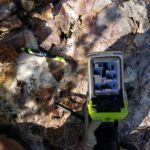
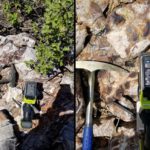
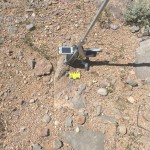
- Close-up outcrop & XRF device, RRC, Oct 2020
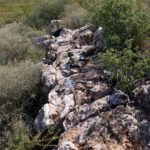
- Outcrop, RRC , Oct 2020
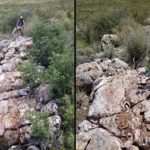
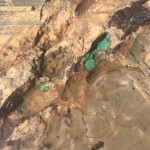
- Jasperoids, Red Rock Canyon, Mapping Project Aug 2020
- Close up jasperoids Red Rock Canyon, Mapping Project, Aug 2020
Hay Mountain Project Images & Maps
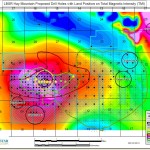
- 1. Surface mag reflecting pluton at depth with drill targets (indicated by stars), and crossing the geochem contour lines east to west [October 2015]
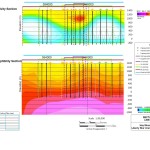
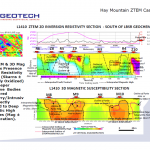
- 2. Cross section on top is EM, Cross section on bottom is 3D Mag to depth. Mag hi reflects pluton [October 2015]
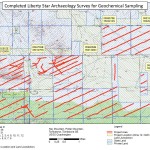
- 3. Arch Survey Map October 2015
- 4. Arch Survey Map October 2015
- 5. Arch Survey Map October 2015
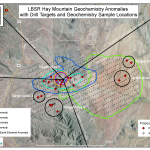
- 6. Hay Mtn geochem anomalies w/ drill targets and geochem sample locations
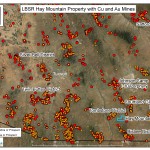
- 7. Hay Mtn property local Cu and Au mines
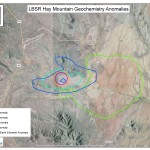
- 8. Hay Mtn geochem anomalies
- 9. Southeast Arizona Cu and Au mining districts
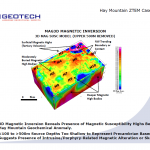
- 10. Mag3D magnetic inversion Feb 2014
- 11. L1410 ZTEM 2D Inversion Resistivity Section Feb 2014
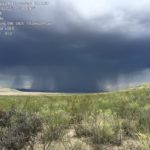
- 12. Cochise County Monsoon season microburst July 2017
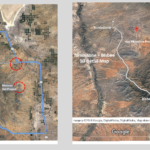
- 13. Aerial Map, Cochise County
- 14. Green copper mineral malachite in leached capping Niton geochem Sept. 2015
- 15. Niton geochem -21% copper Sept. 2015
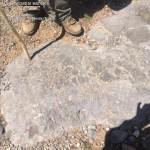
- 16. Niton geochem Sept. 2015
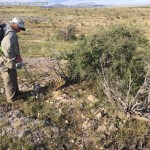
- 17. Niton geochem on Breccia pipe Sept. 2015
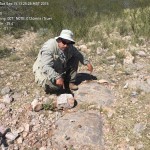
- 18. Niton geochem – green copper oxide broken from Niton anomaly Jay Crawford points to exposed copper from breccia pipe his L hand indicates source Sept. 2015
- 19. Niton geochem- Breccia pipe, typical of porphyry copper deposits. Fragments have re-cemented themselves Sept. 2015
- 20. Niton geochem Sept. 2015
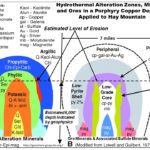
- 21. Lowell & Guilbert Porphyr Model Applied to Hay Mountain 01.09.2017
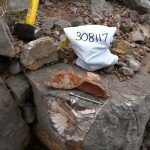
- 22. Geochem Sample, 2011
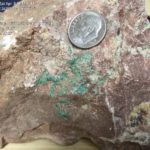
- 23. Surface Sample 1, copper oxide – coarse calcite
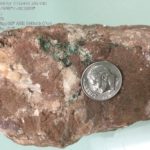
- 24. Sample 2, copper oxide, coarse calcite
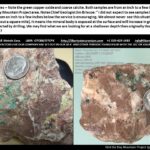
- 25. Click to enlarge – read about the samples
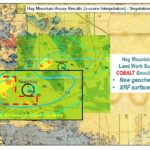
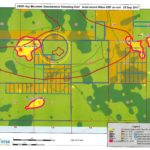
- 26. Cobalt Anomaly bears further investigation August 2017
- 27. The total area of these four mineralized areas is (by using Google’s calculations) about 0.56 square miles. There is about 13 smaller blobs of high Cobalt, nickel and other minerals.
- 28. Copper oxide & close up, east side of Zebra Ridge, Mapping Project, Aug 2020
- 29. Copper oxide in carbonate, Bonanza Belle, Mapping Project, Aug 2020


